The GeoLocator Dashboard: A Window into the v3.0 Engine
Archived — superseded by GeoLocator 4.0
This post describes the dashboard as it launched in December 2025, on the now-retired v3.0 engine. The accuracy, speed, uptime and API statements it originally made were never measured or shipped, so they have been removed rather than restated. GeoLocator 4.0 is the current engine and the first version measured on our own published benchmark.
We had just published the v3.0 reasoning engine, which explained its evidence before committing to a location. This post announced the interface built to use it: a browser dashboard where you upload a photograph, watch the reasoning appear and see the result on a map.
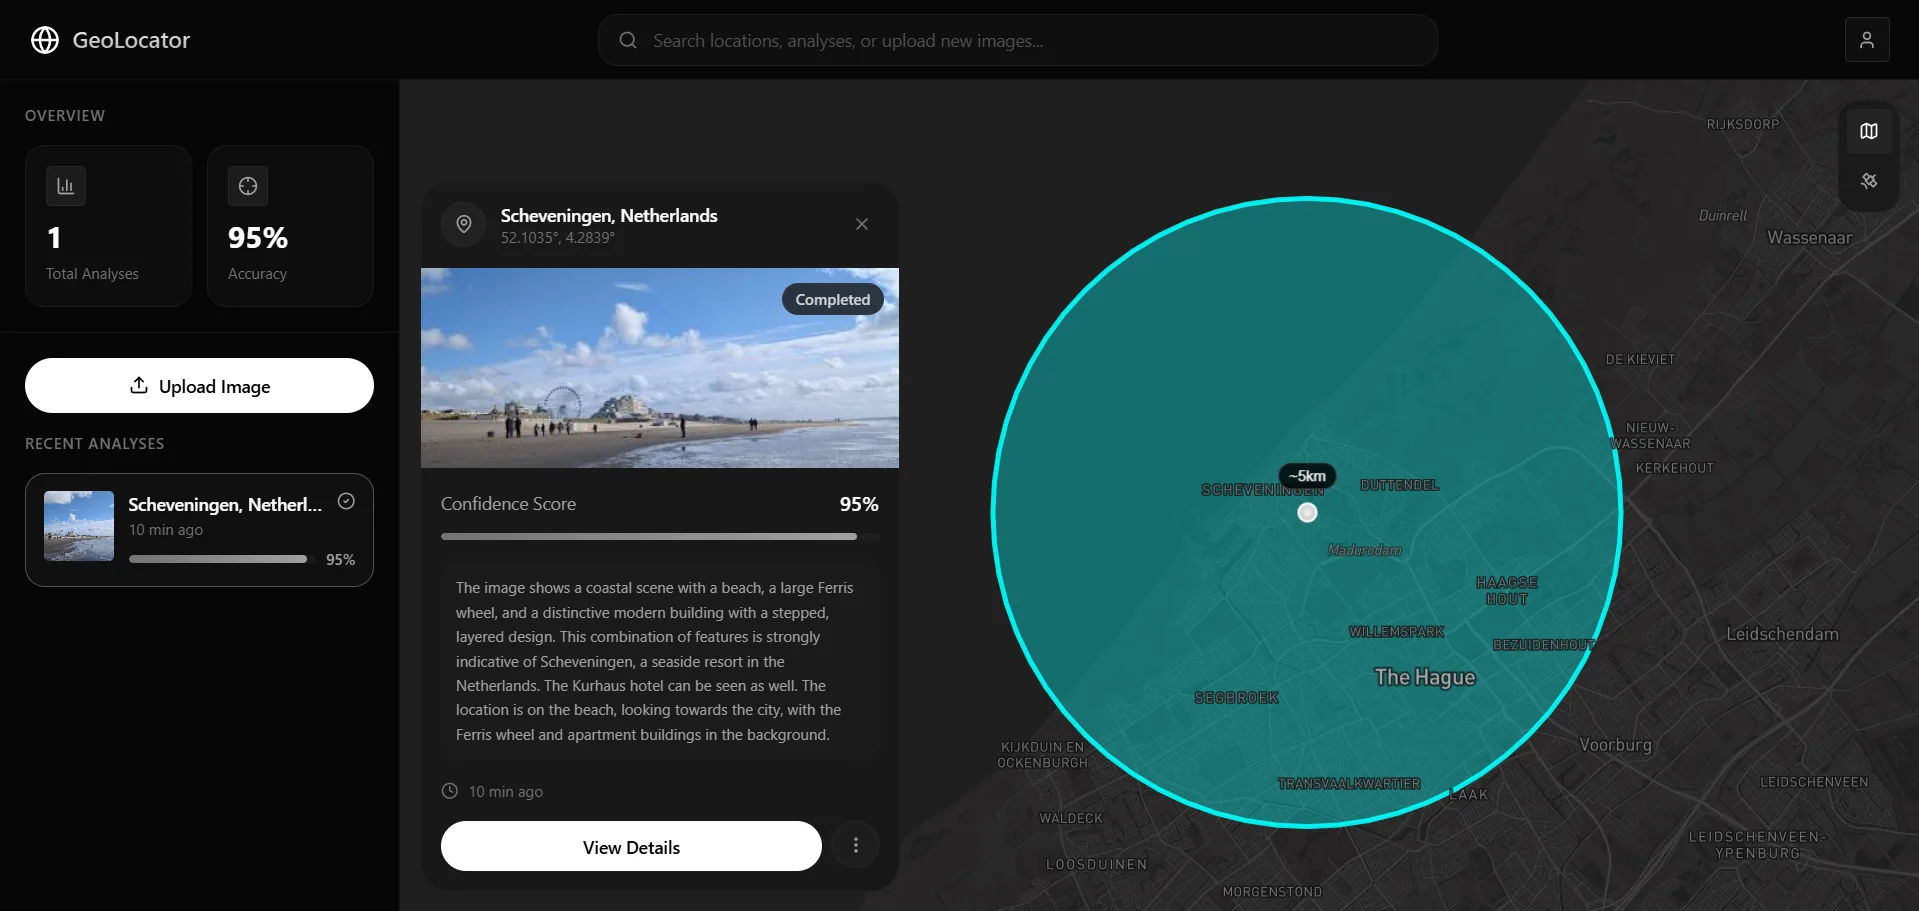
The dashboard as it looked in December 2025, showing one example analysis. The percentages in the screenshot are that single result's own confidence score, not a measured accuracy figure.
Why the reasoning belongs in the interface
Most geolocation tools hand you a coordinate and ask you to trust it. Because v3.0 wrote down the visual evidence it used — architecture styles, plant types, road markings — the dashboard could show that text next to the answer, so a user could check the argument rather than the pin.
What shipped
The dashboard was built around the workflow of OSINT researchers and analysts who need to verify a location rather than just receive one.
1. The reasoning panel
Instead of showing metadata, this panel streamed the model's written evidence as it was produced.
Read what the model saw
If the answer was Poland, the panel said why — the brickwork, the road signage — so a confident-sounding mistake could be caught on the spot.
A confidence score on every result
Each analysis carried the model's own confidence in its reasoning, shown next to the location so weak reads stood out.
2. Mapping and verification
An estimate is only useful if you can check it, so the map was built for comparison rather than decoration.
The estimate, drawn as an area
Results were shown as a circle around the predicted point rather than a single pin, to make the point that the output is an estimate with uncertainty attached.
Satellite verification
Switching to satellite view let users match the landmarks mentioned in the reasoning panel against the imagery — the red roof tiles, the junction, the line of trees.
From research to reality
We built the dashboard because the Python scripts we used for v1.0 and v2.0 were not something anyone else could use.
OSINT & journalism
Verification
Upload a photo and get not just a location but a justification that can be quoted and checked.
Research
Triage
Work through a set of images quickly, then spend the time on the ones whose evidence looks thin.
What happened next
The dashboard is still here, but the engine behind it is not. In September 2026 we replaced v3.0 with GeoLocator 4.0, which separates seeing, deciding and mapping, and is the first version we measured on our own benchmark and published the results for. The plans listed here at the time — including a public API — were not shipped; there is still no public API today. You can try the demo on your own photo.